Chapter 3-3: Process Definition |
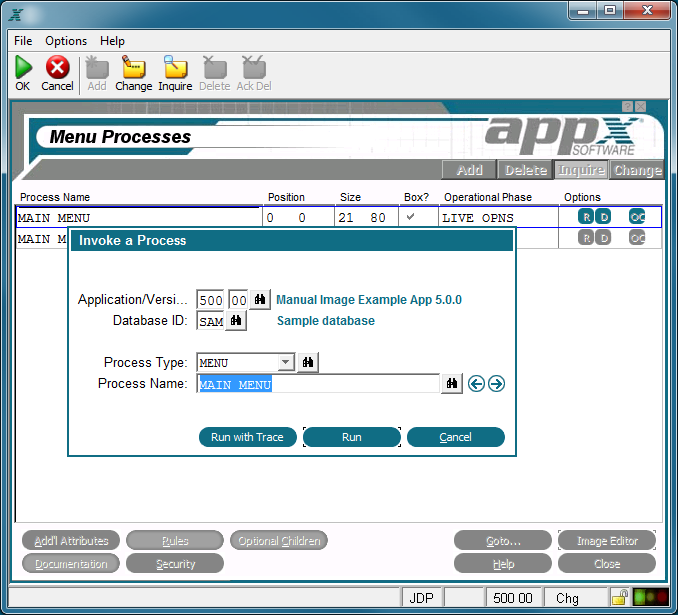
Invoke a Process Overlay The Invoke a Process overlay is the same when you select the invoke a process option anywhere in Application Design, although the level of defaults may vary. The figure below shows the overlay called from a menu process which defaults the currently selected process.
Invoke a Process Overlay You can change the default values on the Invoke a Process overlay to invoke any process name or type that you choose. This overlay also contains the following option: Run with Trace The run with trace option supplies you with a trace log that itemizes everything APPX has done during the execution of the selected process when the selected process is finished. Each line of the trace log shows a sequence number and a description of the logged event. The display of the trace log permits you to browse the trace in a hierarchical fashion. Events that have additional detail are identified by a greater than sign (>) next to the sequence number. To view the additional detail, place the cursor on the record and select enter. To return to a higher level, select end.
Selecting the cancel Use the inquire option to switch to key entry at any time; this allows you to reposition yourself to a particular sequence number. While viewing a trace log, you can also use the hidden Option 1 to view the entire trace in chronological (sequence number) order. |
Application Design Manual "Powered by Appx Software"1080 ©2006 By APPX Software, Inc. All Rights Reserved |
 icon from the toolbar exits the trace display from any level.